7 min read
Case Study: American Airlines Addresses Repetitive Faults With Data
Veryon Feb 18, 2021 5:18:00 AM

Karl Ries, Senior Manager Tech Support Desk Maintenance Operations Control, American Airlines shares some experience using advanced software tools to mine valuable information from log pages.
Before launching into the meat of this case study, it will probably be useful to set the scene with some information about American Airlines.
American Airlines
The History
The business has been flying for 92 years starting with Charles Lindbergh who, in April 1926, flew the first American Airlines flight — carrying U.S. Mail from St. Louis, Missouri, to Chicago, Illinois. After eight years flying mail routes, the airline began to form into what it is today. American’s founder C.R. Smith worked with Donald Douglas to create the DC-3; a plane that changed the entire airline industry, switching revenue sources from mail to passengers.
Today
Currently, American Airlines serves over 350 destinations in 50 countries on five continents and has a main fleet of more than 950 aircraft comprised of nine different aircraft types.
Wide Body Fleet

- Boeing 777-200 and -300
- Boeing 787-8 and -9
- Boeing 767
- Airbus A330-200 and -300
Narrow Body Fleet
- Airbus A320 family (A319, 320, and 321)
- Boeing 737 and 737 MAX
- Boeing 757
- Embraer E190
- MD80
So the business manages many different fleet types that generate large amounts of data, especially when it comes to pilot and maintenance reports.
Challenges Facing Maintenance Operations Control
Maintenance Operations Control (MOC) faced a number of specific challenges that could be grouped under the broad heading of Repetitive Discrepancy Control; looking at pilot and maintenance reports and being able to identify repetitive issues that needed to be addressed. From the merger of US Airways and American Airlines, MOC inherited two legacy-based systems for identifying repetitive issues. The main challenge was simply managing two systems and processes, which drove ad hoc and interim solutions. Additionally, MOC also had difficulty with the analysis and validation of corrective actions which drove using numerous applications to try and obtain data for reviews. Having different sources could prolong the workload and create the potential for missed alerts and inaccurate results. This prevented an efficient process for management and oversight, i.e. it was difficult and labor-intensive to get reports to assist in identifying the main issue of the day.
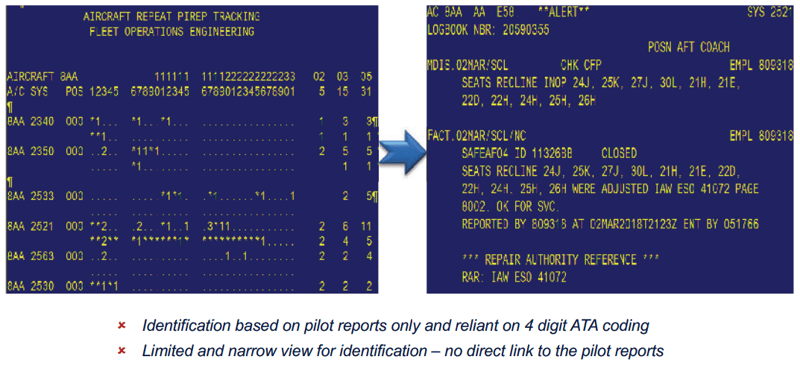
Figure 1.
The left screenshot showcases one particular aircraft showing all the ATAs that are being triggered or had a write-up against them in a 31 day period. The top row displays the specific dates in the 31 day period.
The right screenshot shows the actual discrepancy write-up. Even with that information, there was no direct link and users had to go to another source of information and start looking at each individual write-up. Additionally, because there was no continuity between reported issues, it was easy to miss a repetitive issue on any one item. Identification was based on PIREP (Pilot Report) reports and didn’t pick up on maintenance reports, another place where a data set was completely missing. The repetitive triggers were heavily reliant on 4 digit ATA coding which, if it was off by just one digit, meant the issue was not captured for a potential repetitive defect review. Basically, there were limited views to try to identify issues and there was no direct link to the pilot/maintenance reports.
Partnership with Veryon and Using Veryon Defect Analysis
With the existing challenges, the search for a solution began. Discussions with others in the industry and One World partners were initiated to review how repetitive defects were managed. Discussions led to the discovery of Veryon Defect Analysis. From a demonstration, MOC decided to set up a trial to determine whether this could be a solution for the new and combined American Airlines’ Tech Ops.
Trial Period
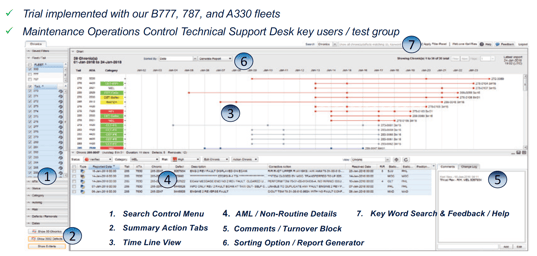
It was decided to conduct the trial on the Boeing 777s, 787s and the Airbus A330s. The screenshot in figure 2 shows the main screen of Veryon Defect Analysis with each numbered area showing the key elements. The screen layout provided ‘one-stop-shopping’, one area, one platform to be able to identify, manage and validate the corrective actions for repeat issues.
Filter Controls
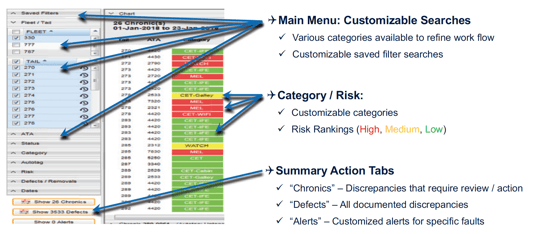
The Filter Controls allow each user to rapidly configure what they want to see on their screen. This can be seen in figure 3. This example is based on the A330 fleet with all the A330s selected but the system is customizable with various categories available to refine the user’s workflow. Users can save any number of their views for instant recall. Similarly, Categories and Risks are customizable and, if the user wants to use Risk Rankings for an SMS (Safety Management System) type of philosophy, the system provides the capability to categorize as High, Medium or Low. Also, the option exists to create custom categories. Figure 3 shows an example for CET, an abbreviation in American Airlines for Cabin Experience Team whose focus is on passenger experience-related items — interiors, Wi-Fi, and In-Flight Entertainment.
Customized Alerting
The main function of Veryon Defect Analysis is to identify recurring defects that a user might not have otherwise noticed, but it also provides alerts for issues that are of special interest. The user can set up customizable email alerts based on keywords and able to be set on one reported event, not dependent on repetitive reports. With this ability, users can address specific trending discrepancies at the first event instead of it becoming a reoccurring repetitive issue.
Overall, the recurring theme with Veryon Defect Analysis is ‘customizable’. Veryon Defect Analysis allows users to go into the categories and use their own terminology for their airline. It isn’t necessary to contact Veryon every time a user needs to revise categories. It’s all very customizable by end-users.
Time Line
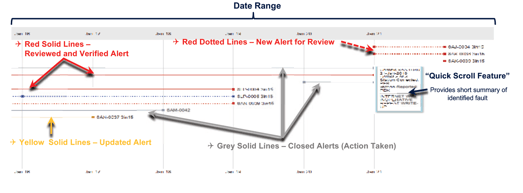
Figure 4 shows a time line view, with the colors of American Airlines’ choice. With this view, the red dotted lines indicate new alerts for review and each square identifies a write-up. A single click will access those alerts; get all the log page data or the maintenance reports to research if there’s an issue that needs to be addressed.
The solid red lines indicate that the issue has already been looked at and verified. The decision can be made whether to create an action plan or continue monitoring.
For items that have an additional associated write-up for a verified alert, the alert will come back flagged as a yellow alert to assist in alerting the user that additional action may be required. The gray lines are closed alerts, items reviewed and where actions have been taken that the user believed fixed the issue.
The Quick Scroll feature is an added benefit. Without having to click to look at all the details, users can easily hover over a square to see a summary of identified faults.
These graphical tools ensure that users have critical information readily available and they assist in managing identified issues.
Details
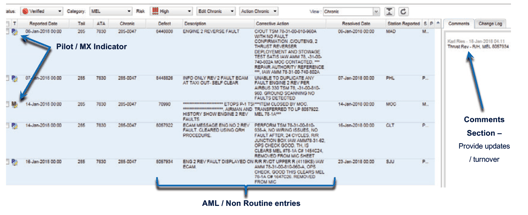
The Details view shown (figure 5) displays where there was a repetitive issue with a thrust reverser on an A330. All the detail is there (including dates and times) using crew and maintenance reports to tell the story of what is going wrong with this aircraft. The Comments section allows the option to provide additional turnovers and updates on actions taken. So, Veryon Defect Analysis once again provides a centralized area for the information, helping contain the number of repetitive reports.
Text Analytics


The top example illustrates the power of Veryon's algorithms and text analytics. In the illustrated example (figure 6), on a Boeing 787, for three days in a row it had a cabin air compressor fault. It can be seen that two of the ATAs were properly coded to 2150 but one was coded to 2497. With the legacy tools, that would never have been noticed and the first write-up on December 14th would have been missed. But the Veryon Defect Analysis system is not dependent on ATA coding; it can identify repetitive issues with mixed ATAs. It really focuses on what has been documented and does a great job with text analytics.

Looking at the bottom example, there are some interior write-ups that deal with IFE (In-Flight Entertainment) and there is a cluster of seats written up for each discrepancy. With the clustered information, Veryon Defect Analysis is able to pick out recurring issues even if they are buried within lists of seat numbers. As can be seen with the bottom example, Veryon Defect Analysis picked up on seat 1A which was being reported constantly during that time frame. The clustered information is narrowed down to that level of detail which really helps find those hidden chronics.
Reporting
Reporting is a great feature with two options: a summary or all detail reports. But ultimately, it’s an ability to generate reports based on user input. It can identify a certain fleet, a certain aircraft, and a certain aircraft with specific sets of ATAs. It doesn’t matter, the choice is up to the system user as to what data they want to be displayed and there’s a standardized format for them to generate those reports. With standardized reporting, everyone will receive the same report format, as opposed to the ‘ad hoc’ reporting that had previously been accomplished.
All Defects
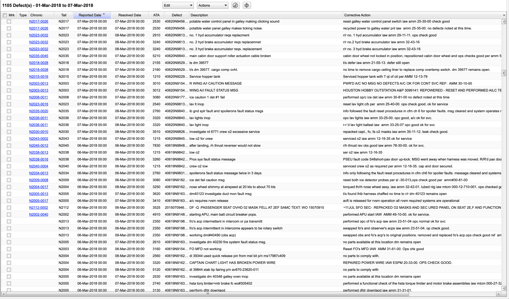
Figure 7 shows the All Defects View. ‘Defects’, as defined by Veryon, includes all write-ups; pilot and maintenance write-ups. Italicized entries displayed show that Veryon Defect Analysis has identified write-ups as being actions that are not reports related to a repetitive defect. They could be maintenance check sign-offs or installation of gear pins. Those italicized items can be added to a chronic if the user desires, and they can be hidden or revealed with a single click to reduce the screen clutter. MOC users found the flow and the speed of the data was quite impressive. Additionally, impressive, (see figure 8) is the ability for keyword searches.
Key Word Search
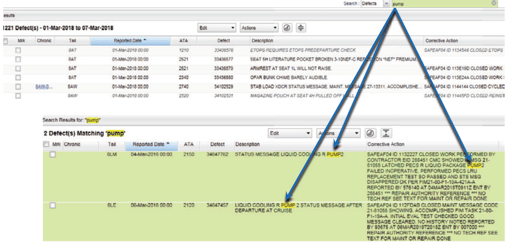
Figure 8 shows an example with a Boeing 787. At the top entry field, the user can type in any keyword or phrase. In this case, the word ‘pump’ is used, and as soon as the user hits ‘enter’ the system does all the data mining and finds all the areas where ‘pump’ was documented. The search field can accept detailed search terms that will focus in on specifics, all the while using its extensive dictionary of terms so that it automatically finds things like abbreviations and synonyms of the search terms. For example, Nose Gear will find a defect containing NLG as a match. This has been helping MOC by speeding up their queries and cutting down on actual data mining.
Trial Results
The trial produced the following results:
- Accuracy: More repetitive issues being identified.
- Efficiency: Decreased time in identifying repetitive issues.
- Knowledge: Powerful analytic tool for performing key word searches.
- Awareness: New capability to have alert notifications for specific events and/or trends.
- Information: Customized reporting – assists in reviews, audits, and correspondence with other departments.
About Veryon defect analysis
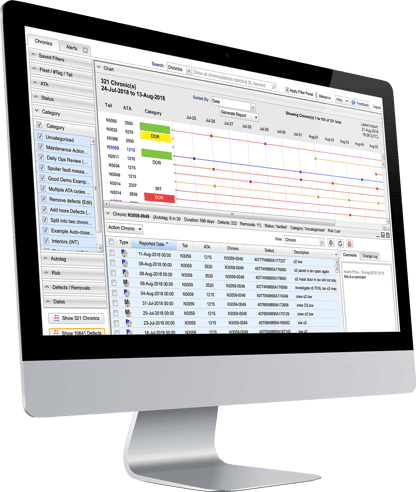
Veryon Defect Analysis identifies, consolidates, and ranks recurring and potential chronic defects regardless of the aircraft type.
Used by more than 25% of the worldwide in-service commercial airline fleet across all manufacturers, Veryon Defect Analysis reduces chronic or repeating defects by up to 33%, lowers unscheduled part removal rates by up to 20%, reduces effort identifying chronic defects from hours to minutes, and reduces cancellations and delays by 10%.
Veryon Defect Analysis helps airlines and MROs improve the overall health of their fleet.


